


Real estate investors often spend endless hours debating prices, payment plans, and finishing levels,yet they miss the most important metric in any coastal investment: tourism demand × occupancy.
This simple formula is one of the most powerful predictors of rental performance and long-term ROI. It tells you, in minutes, why some destinations deliver 10–14% annual returns… while others barely break even.
And no region in Egypt demonstrates this formula better than the Red Sea, specifically: Hurghada, Sahl Hasheesh, and El Gouna.
In this guide, we break down the science behind the equation and show you how to use real data ’not hype’to choose the strongest investment opportunities in 2025.
What Is the “Tourism Occupancy Index”?
The Tourism Occupancy Index is a simple but highly revealing measure:
Annual number of tourists × Average occupancy rate = Market strength + projected rental performance
This number works as a demand thermometer: it tells you how “hot” a city is, how much rental pressure exists, and how confidently you can expect consistent bookings.
In the world of short-term rentals, especially in Airbnb-driven markets, this is a goldmine. Because the higher the tourism flow and occupancy stability, the:
- Higher nightly price
- Stronger annual revenue
- Faster capital recovery
- More stable off-season income
Cities that score high on this index rarely disappoint investors.
Why Foreign Tourism Matters More Than Local Tourism
Local tourism is seasonal.
Foreign tourism is predictable.
Foreign travelers book:
- Longer stays
- Higher-quality units
- More off-season trips
- Repeat annual visits
According to WTTC and Egypt Tourism Authority:
- International arrivals to Egypt reached 12+ million tourists recently, with a strong concentration in the Red Sea region.
- Foreign occupancy is what stabilizes ROI, because it doesn’t follow the same holiday peaks as the local market.
This is why the Tourism Occupancy Index heavily favors coastal cities like Hurghada over destinations that depend on local traffic, such as parts of the North Coast.
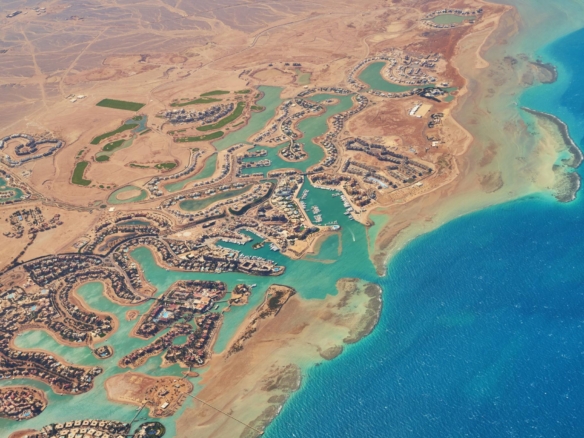
Case Study 1: Hurghada — 12 Million Tourists × 65% Occupancy
Hurghada is the backbone of Egypt’s tourism economy.
12 million tourists annually
65% average occupancy across the year
AirDNA confirms strong ADR and stable seasonal patterns
One of Egypt’s highest Airbnb ROI zones (10–14%)
Hurghada wins because it has:
- International airports
- Year-round visitors
- Strong European market (Germany, UK, Italy, Poland)
- Massive hotel infrastructure
- High tourism resilience
- “Sunshine tourism” demand — not seasonal tourism
These factors push demand even higher, with some zones like El Mamsha, Intercontinental, and Marina showing premium nightly prices.
Case Study 2: Sahl Hasheesh — The Red Sea’s High-Occupancy Fortress
If Hurghada is the engine, Sahl Hasheesh is the private club.
It scores exceptionally high on the Tourism Occupancy Index because:
- Resorts are closed, gated, and extremely high-end
- Demand per unit is higher
- ADR (Average Daily Rate) is one of the strongest in Egypt
- Occupancy surpasses surrounding areas due to resort tourism
- European visitors prefer Sahl Hasheesh for long-stay vacations
Investors here often achieve ROI levels higher than average Hurghada returns, especially with sea-view units.
Case Study 3: El Gouna — Egypt’s Highest Nightly Rates
El Gouna is simply in a category of its own:
- The highest nightly price in Egypt
- High-end clients
- Limited supply vs huge demand
- Stable occupancy even during off-season
- Strong holiday tourism + international kite-surfing community
- Year-round events that drive traffic
Even though El Gouna prices are higher, the Tourism Occupancy Index shows that demand remains solid—making it an excellent rental market with strong resale potential.
What About the North Coast ?
Here’s where the index exposes the reality that marketing doesn’t show:
- Tourism: Mostly local
- Occupancy: Highly seasonal
- Season length: Only 60–70 days
- Winter occupancy: Minimal
- ADR: Lower than Red Sea premium markets
- ROI: Often overstated vs actual performance
This is why many investors achieve 2–4% ROI in the North Coast versus 8–14% in the Red Sea.
The Tourism Occupancy Index eliminates the emotions and shows the truth plainly.
How Tourism × Occupancy Influences Airbnb ROI
Here’s the equation:
More tourists → stronger occupancy → higher revenue → shorter payback period
Airbnb ROI is shaped by:
- Number of bookings per year
- Occupancy percentage
- Nightly price
- Season length
- Traveler type (foreign vs local)
The Red Sea consistently excels in all of these.
AirDNA shows that Airbnb occupancy in Hurghada and El Gouna stays remarkably stable, even in low season, due to foreign tourism cycles that don’t depend on Arab or Egyptian holidays.
This is why short-term rentals in the Red Sea outperform almost all other Egyptian cities.
2025–2026: Cities Expected to Surge
Based on tourism development plans, WTTC projections, and new infrastructure, the following are expected to spike in demand:
Sahl Hasheesh
Upcoming resorts + expanded marina demand
High foreign tourism penetration
Premium ADR growth expected
Makadi Bay
Gaining attention from European tour operators
Stable occupancy with excellent pricing potential
Ras Abu Soma (Soma Bay)
World-class water sports
High-end gated destinations
Very strong foreign tourism base
Hurghada West & Marina Zones
New hotel supply + airport expansions
Strong Airbnb demand
The Tourism Occupancy Index heavily predicts these areas as Egypt’s top coastal performers for the next two years.
Why Investors Should Use This Formula Before Buying
The power of Tourism × Occupancy lies in its simplicity:
- Removes guesswork
- Shows you real demand
- Predicts ROI with surprising accuracy
- Helps you compare cities instantly
- Exposes weak markets early
- Protects your capital
An apartment in a high-tourism city beats a bigger apartment in a low-tourism city almost every time.
Investors who follow data, not hype, make consistently better decisions—and recover their capital far faster.
If you want to know which Red Sea projects score highest on the Tourism Occupancy Index—and which units deliver the strongest Airbnb ROI—our team at Forsa Real Estate is ready to guide you.
We don’t guess.
We work with WTTC, AirDNA, Google Trends, and 12+ years of Red Sea market data to help you choose investments backed by facts, not promises.
Contact Forsa Real Estate today
Let’s build your investment on data, confidence, and real returns.


Join The Discussion